


Figure 1 Correlation between temperatures from observation and the models used for seasonal outlook, the stippling shows the correlation values significant at 95% confidence level.
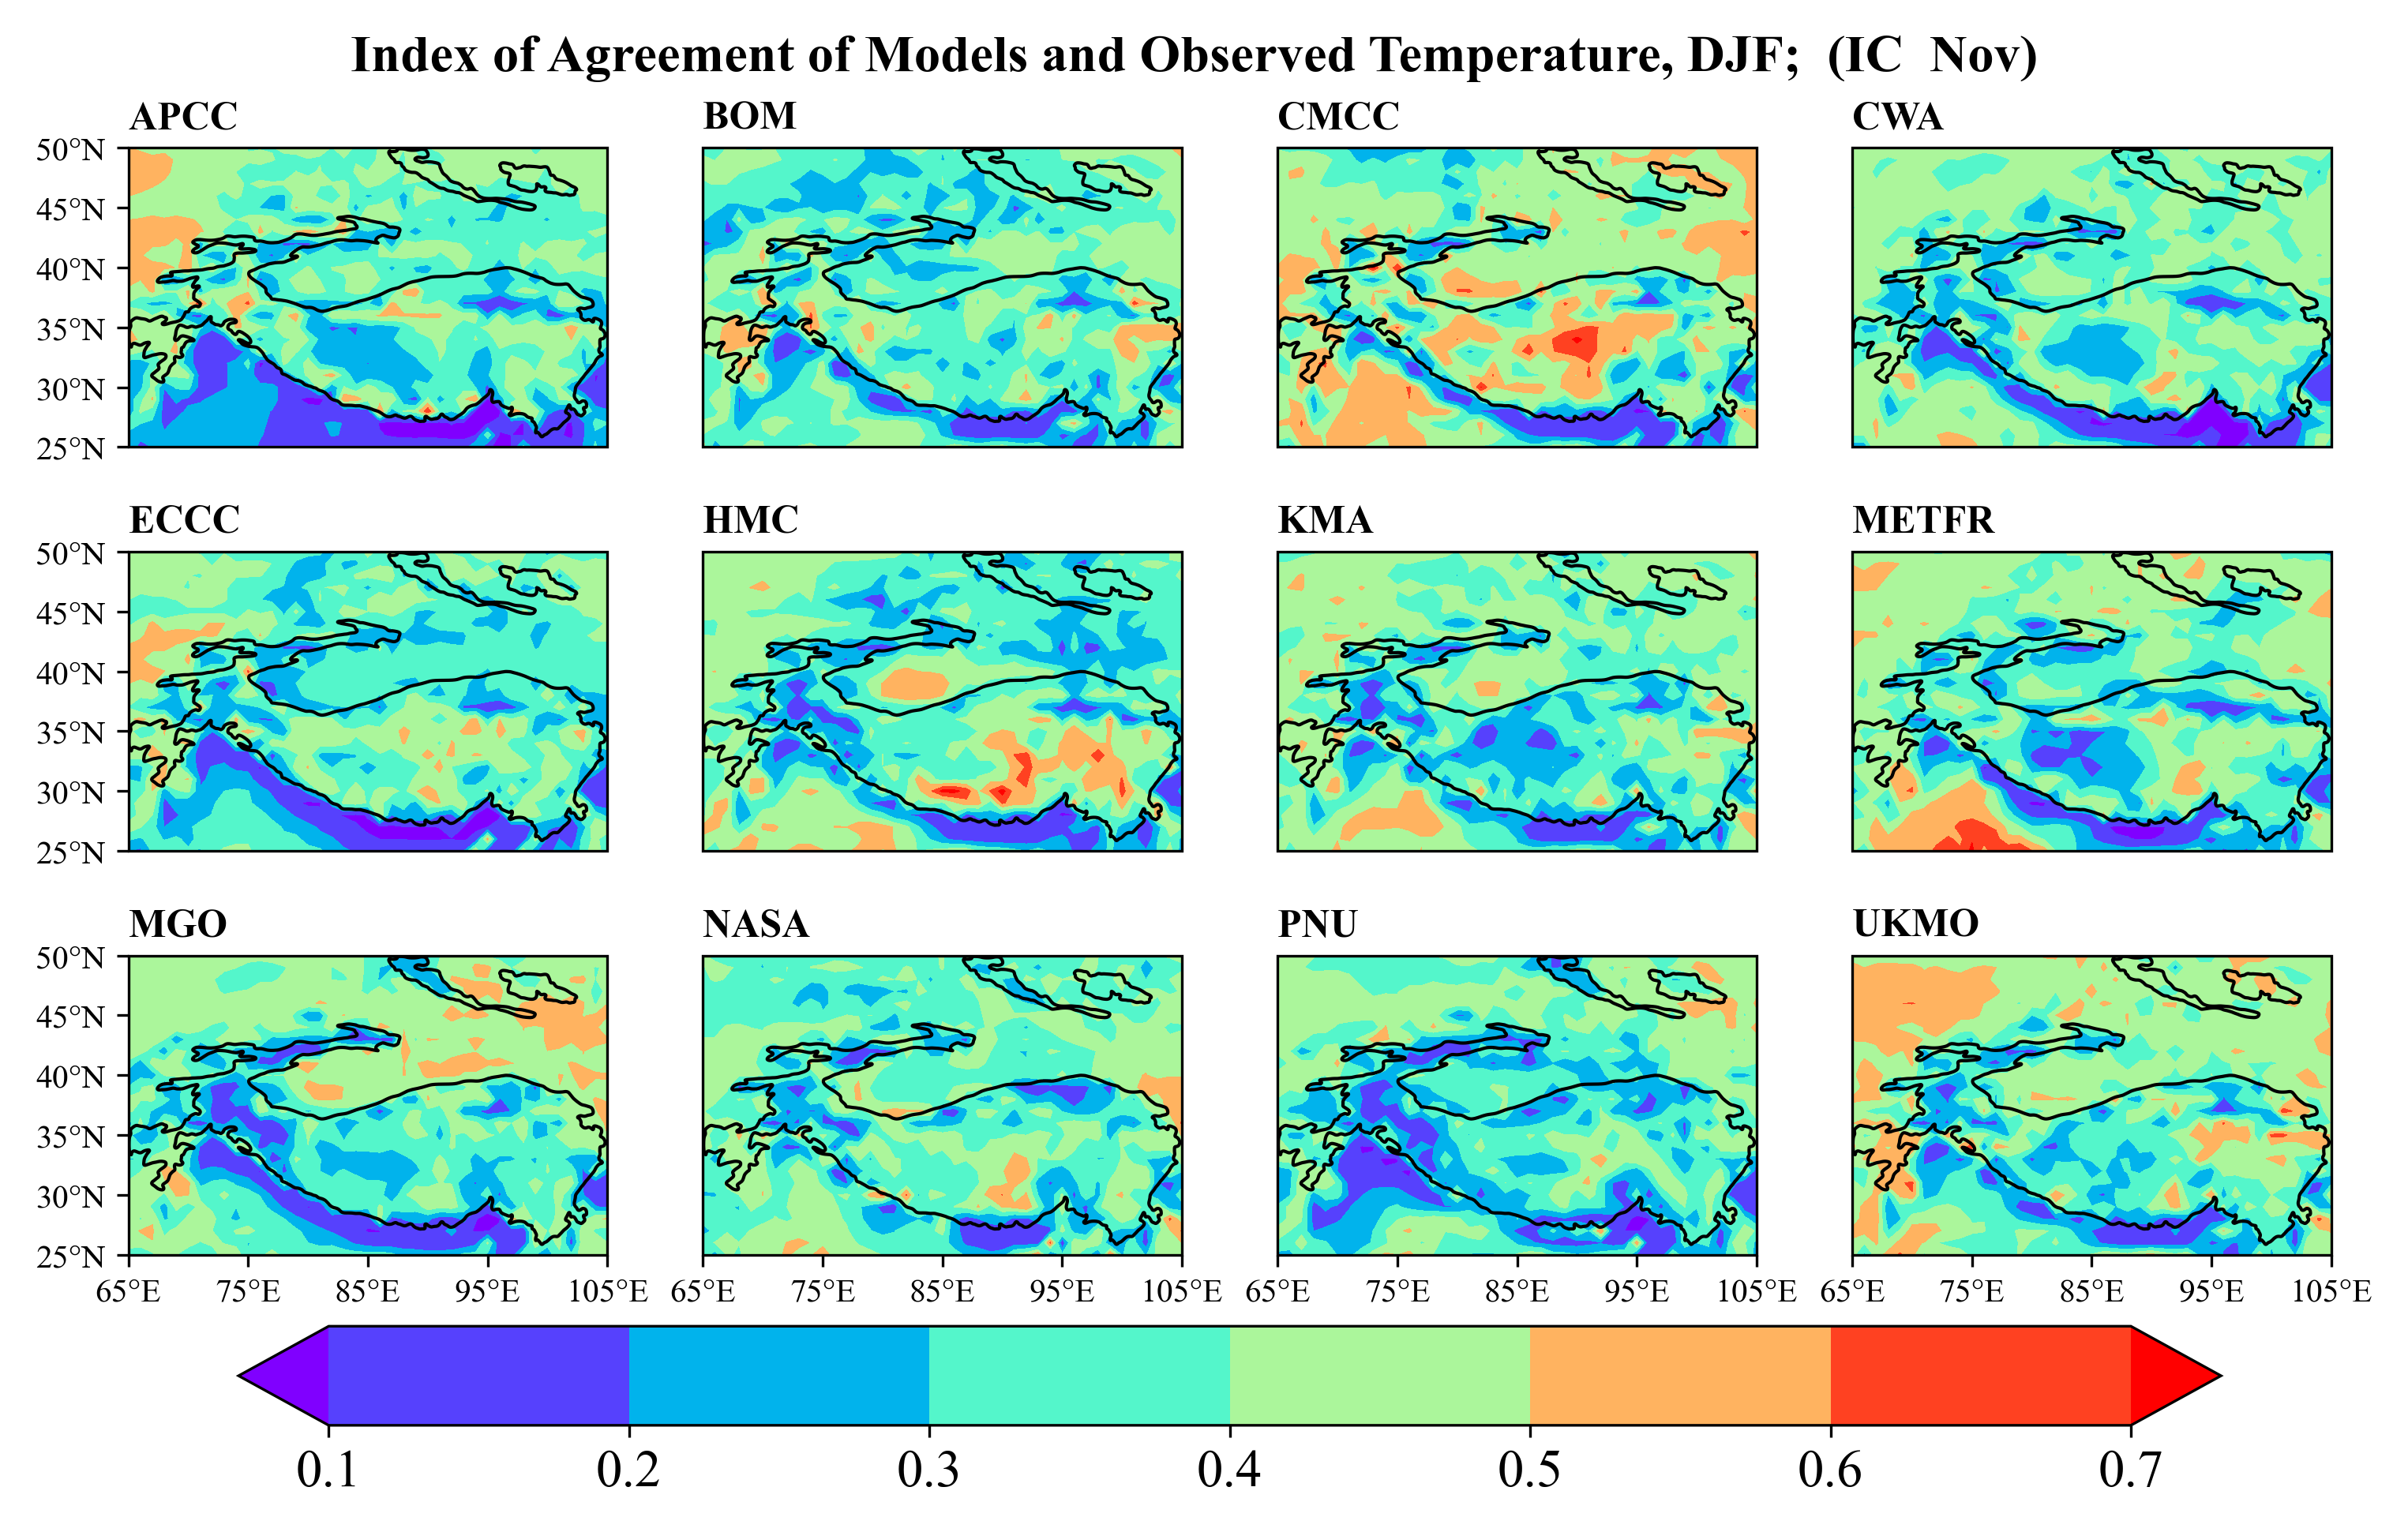
Figure 2 Index of Agreement between temperatures from observation and the models used for seasonal outlook.

Figure 3 RMSE between temperatures from observation and the models used for seasonal outlook.

Figure 1 Correlation between temperatures from observation and the models used for seasonal outlook, the stippling shows the correlation values significant at 95% confidence level.
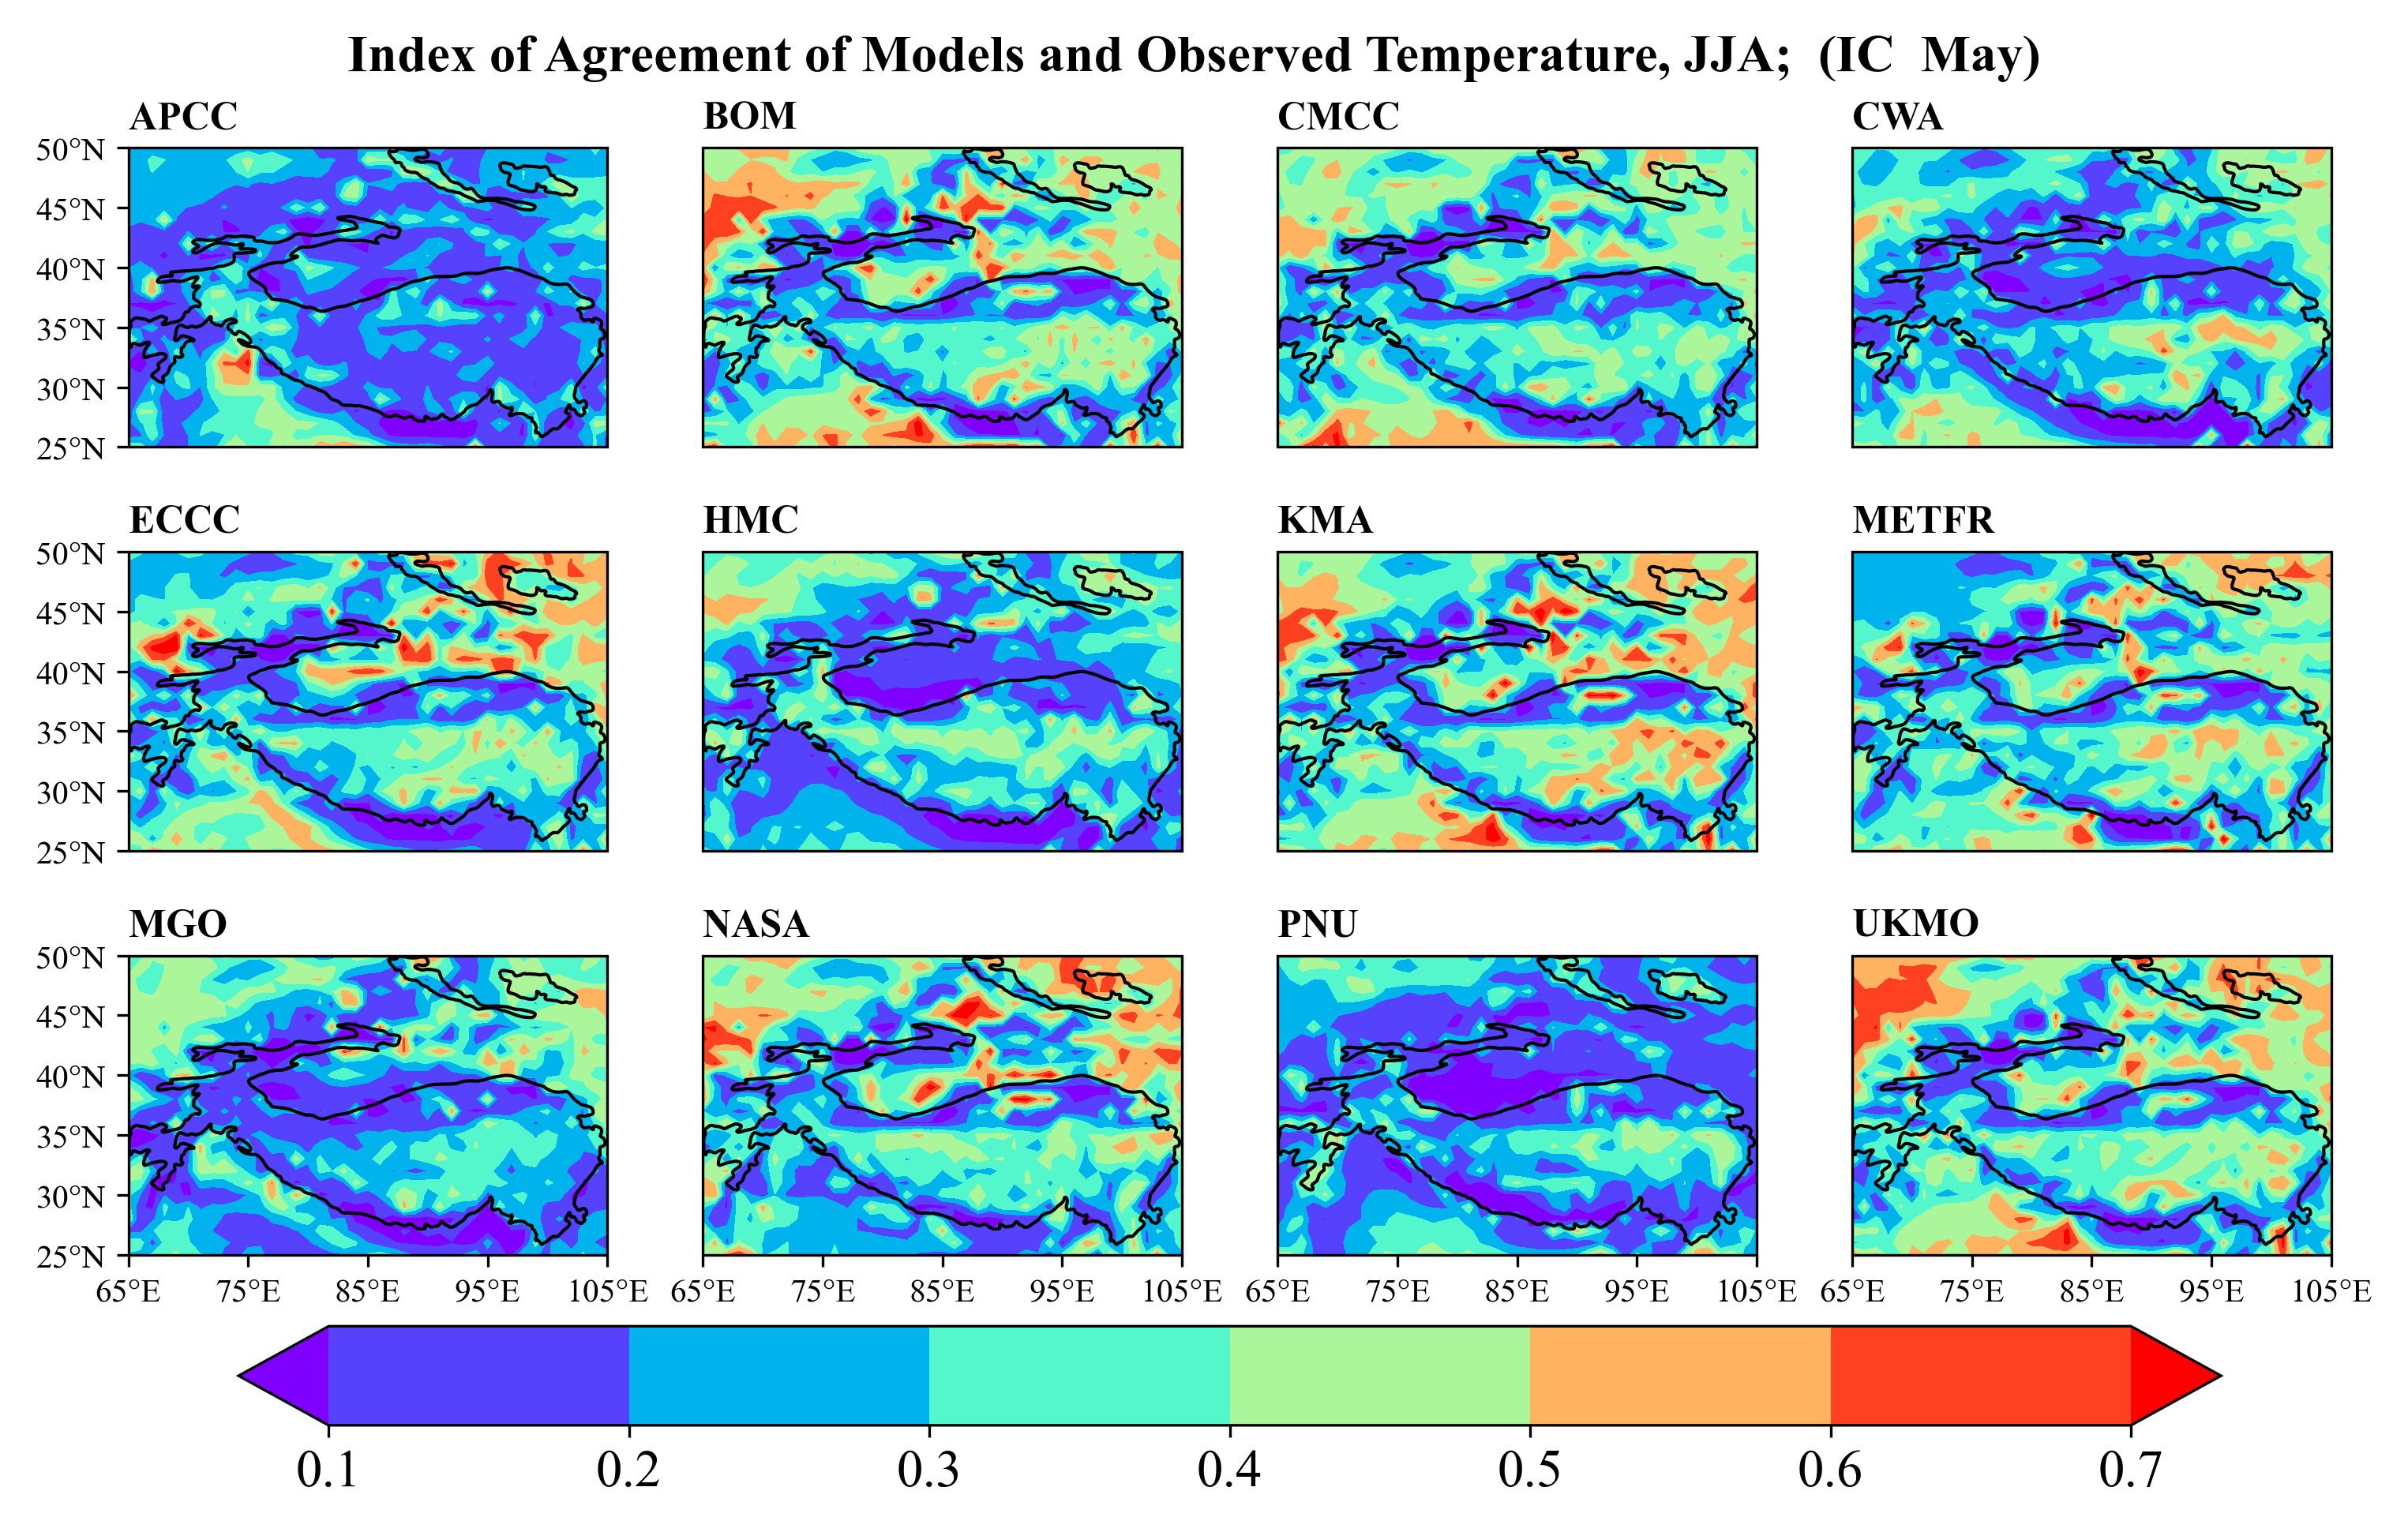
Figure 2 Index of Agreement between temperatures from observation and the models used for seasonal outlook.
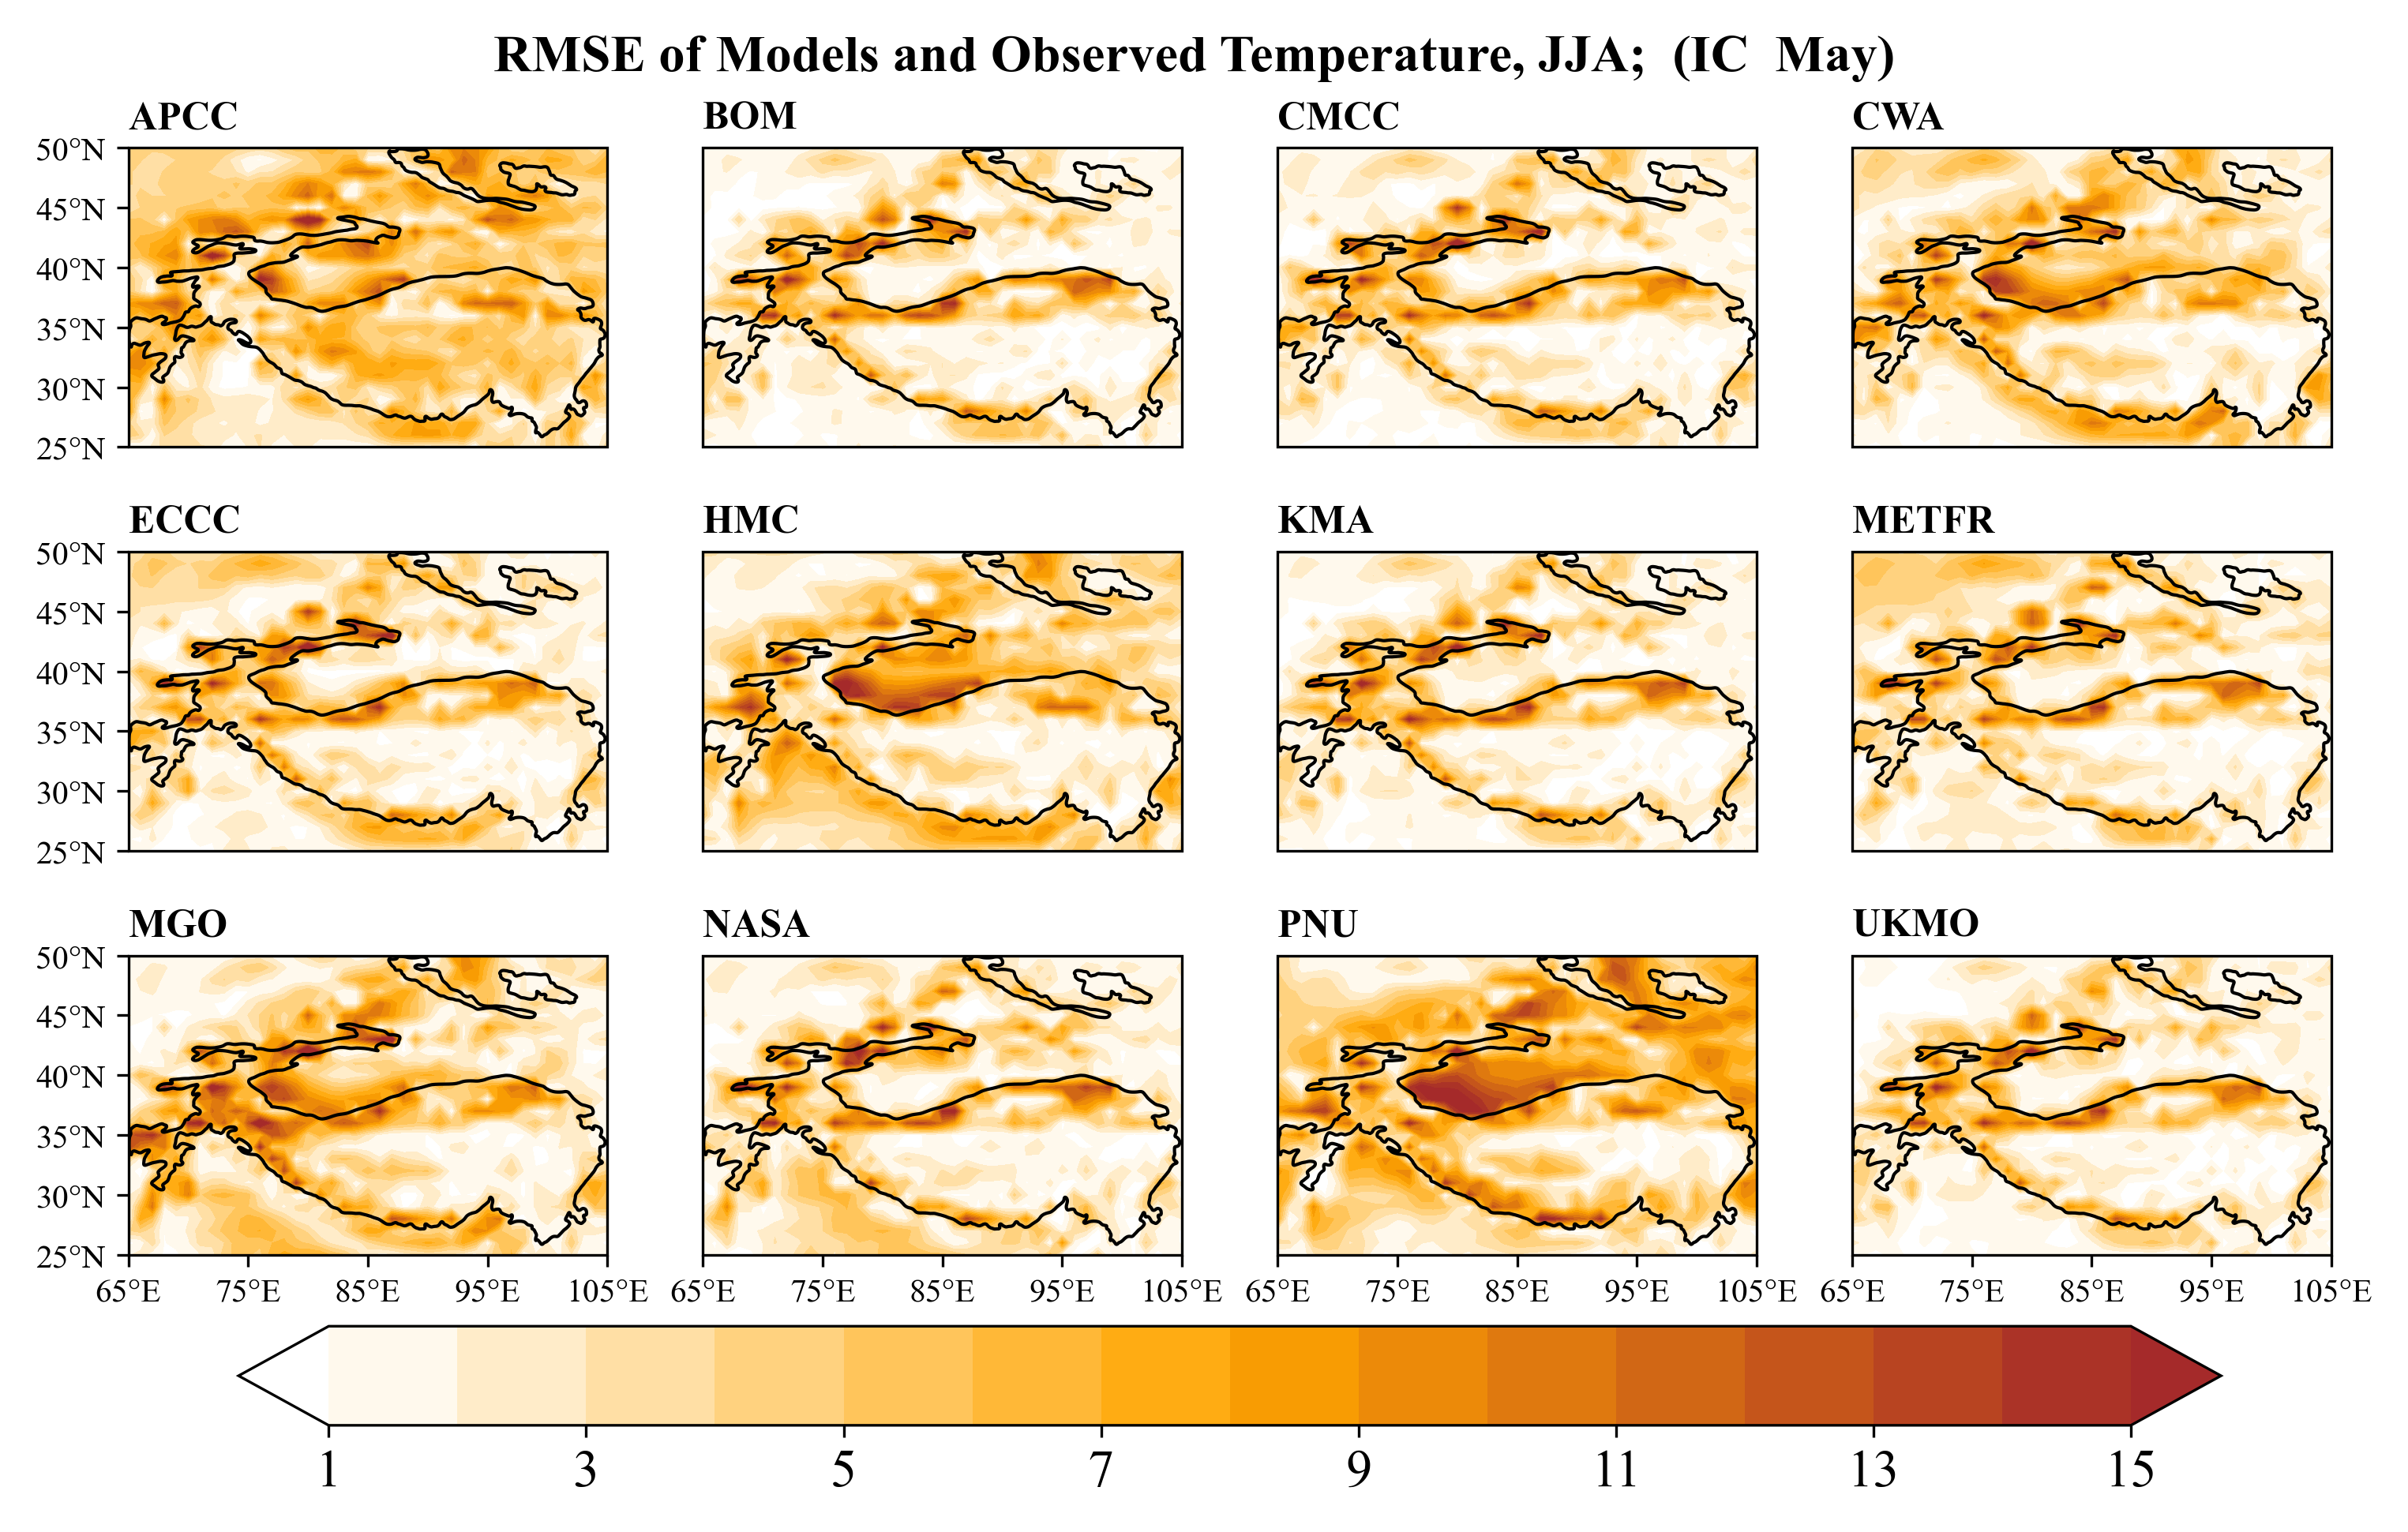
Figure 3 RMSE between temperatures from observation and the models used for seasonal outlook.

Figure 1 Correlation between temperatures from observation and the models used for seasonal outlook, the stippling shows the correlation values significant at 95% confidence level.
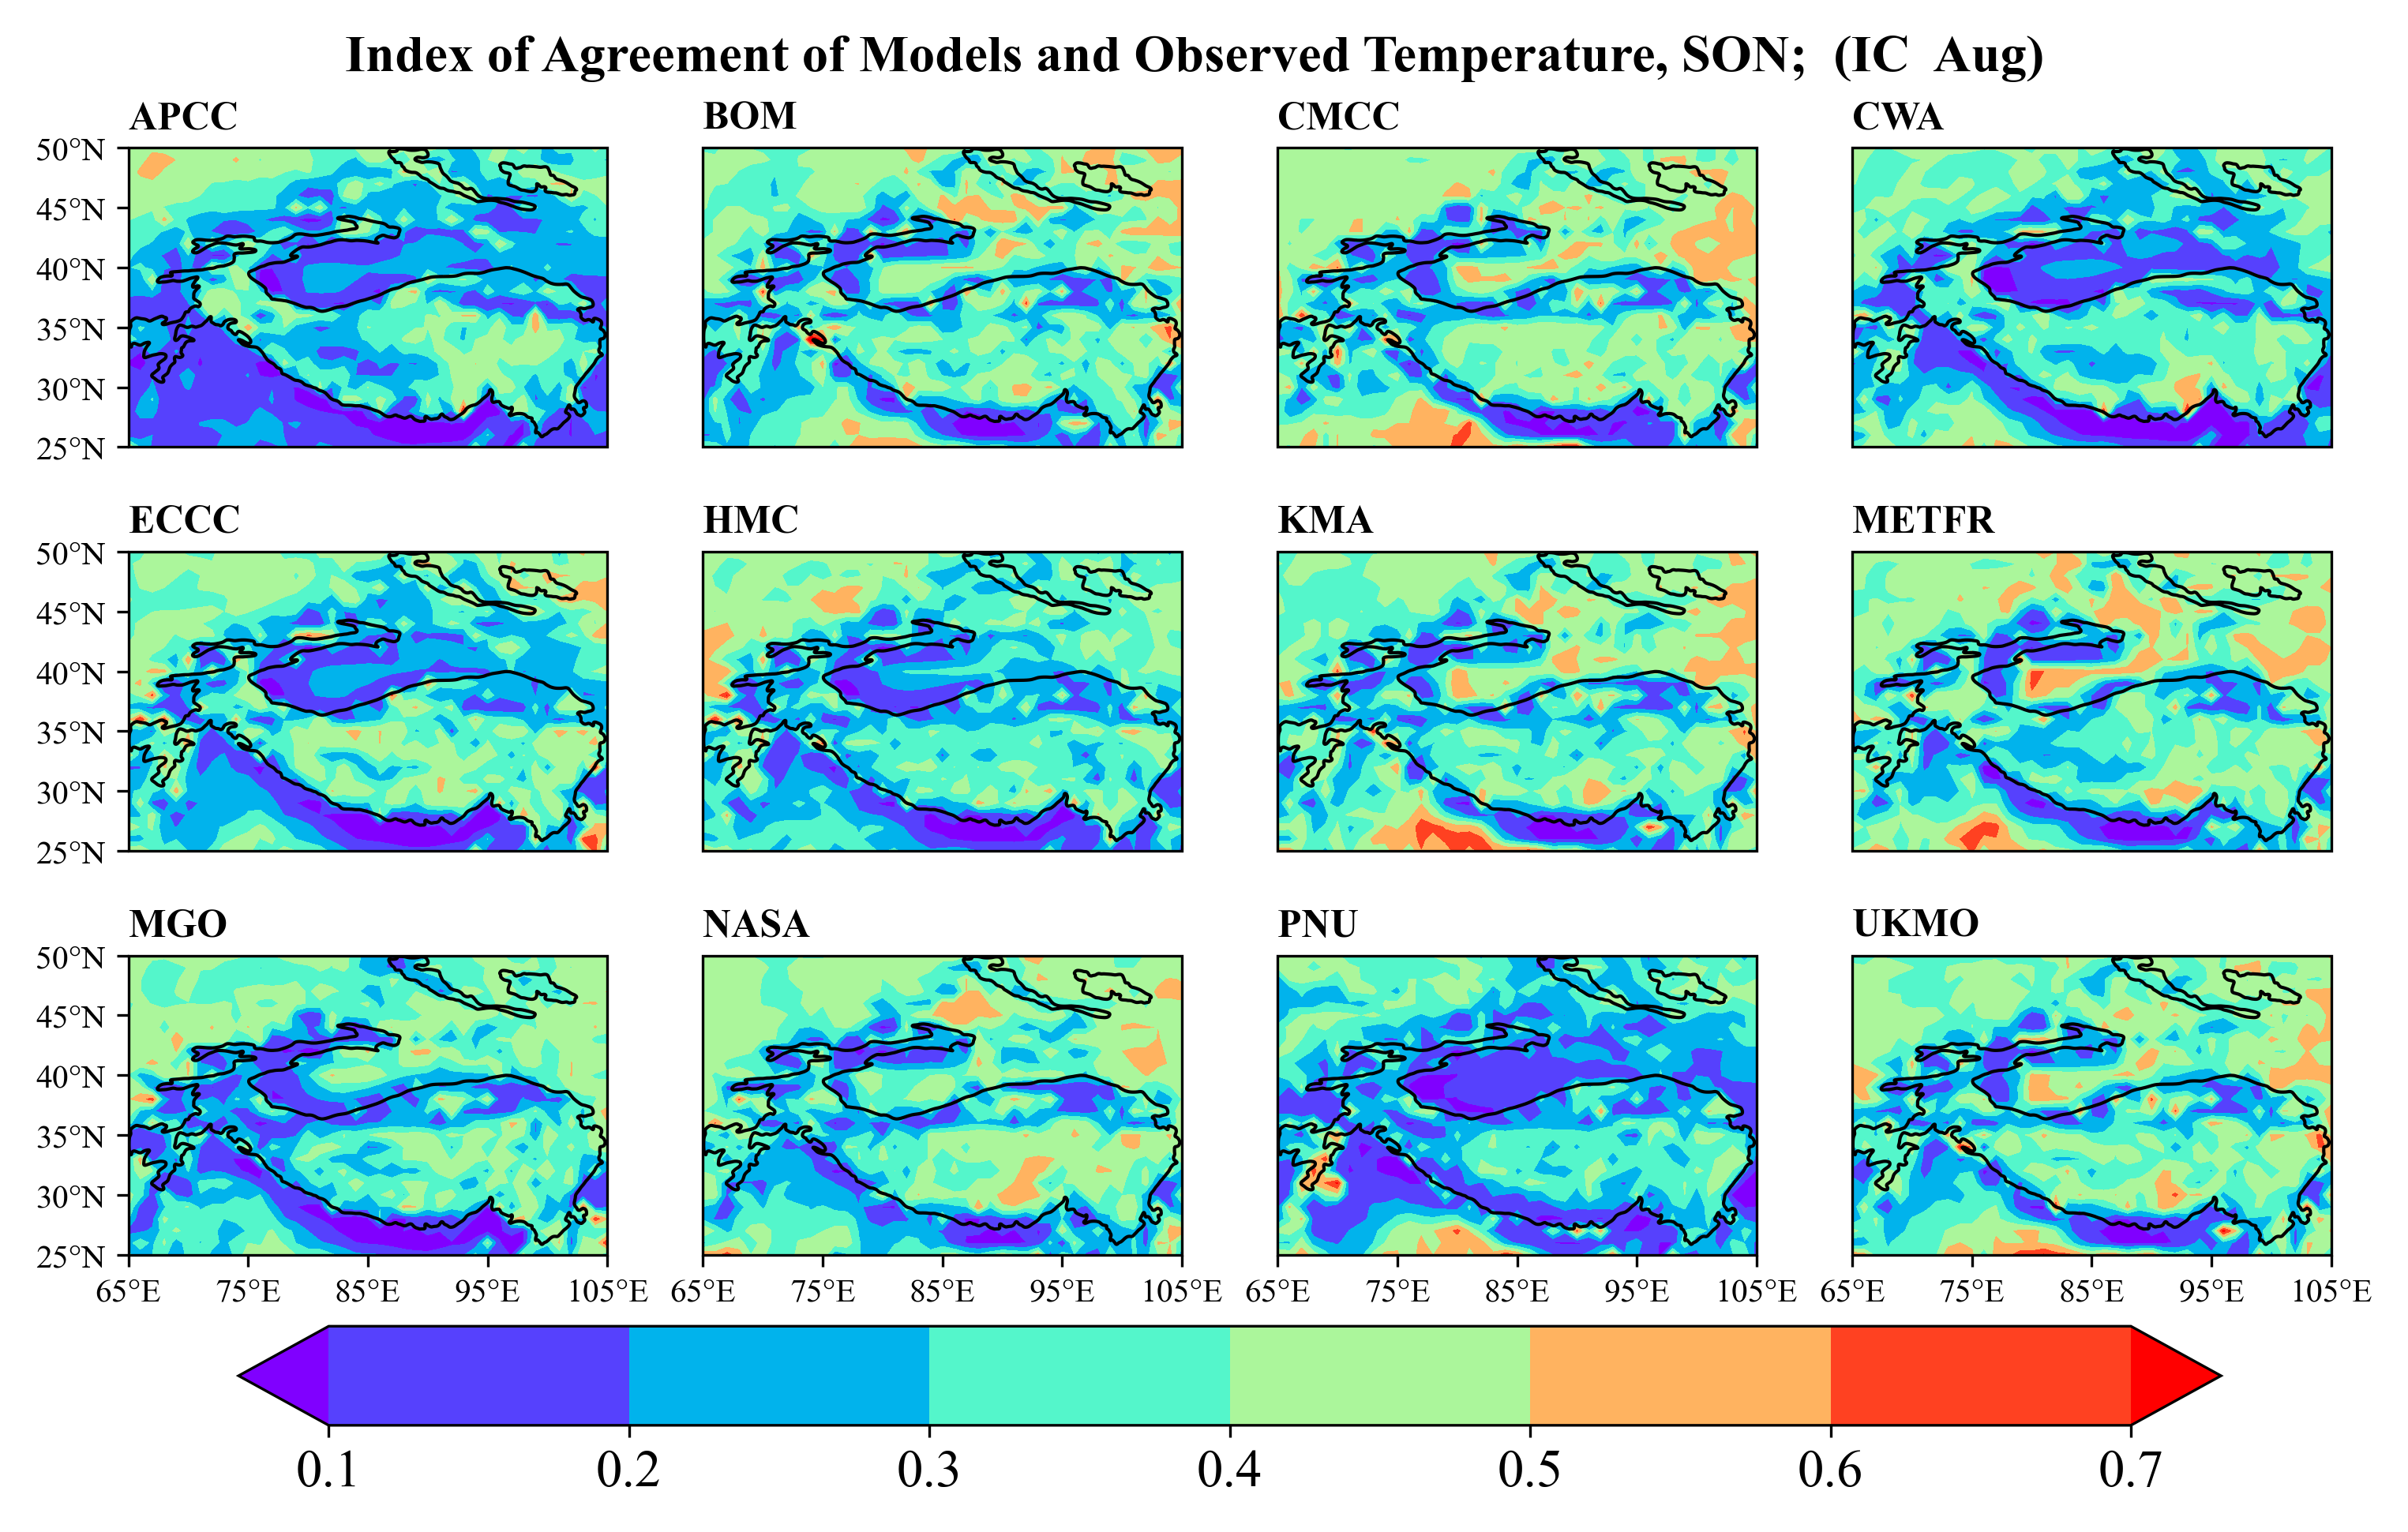
Figure 2 Index of Agreement between temperatures from observation and the models used for seasonal outlook.

Figure 3 RMSE between temperatures from observation and the models used for seasonal outlook.

Figure 1 Correlation between precipitation from observation and the models used for seasonal outlook, the stippling shows the correlation values significant at 95% confidence level.
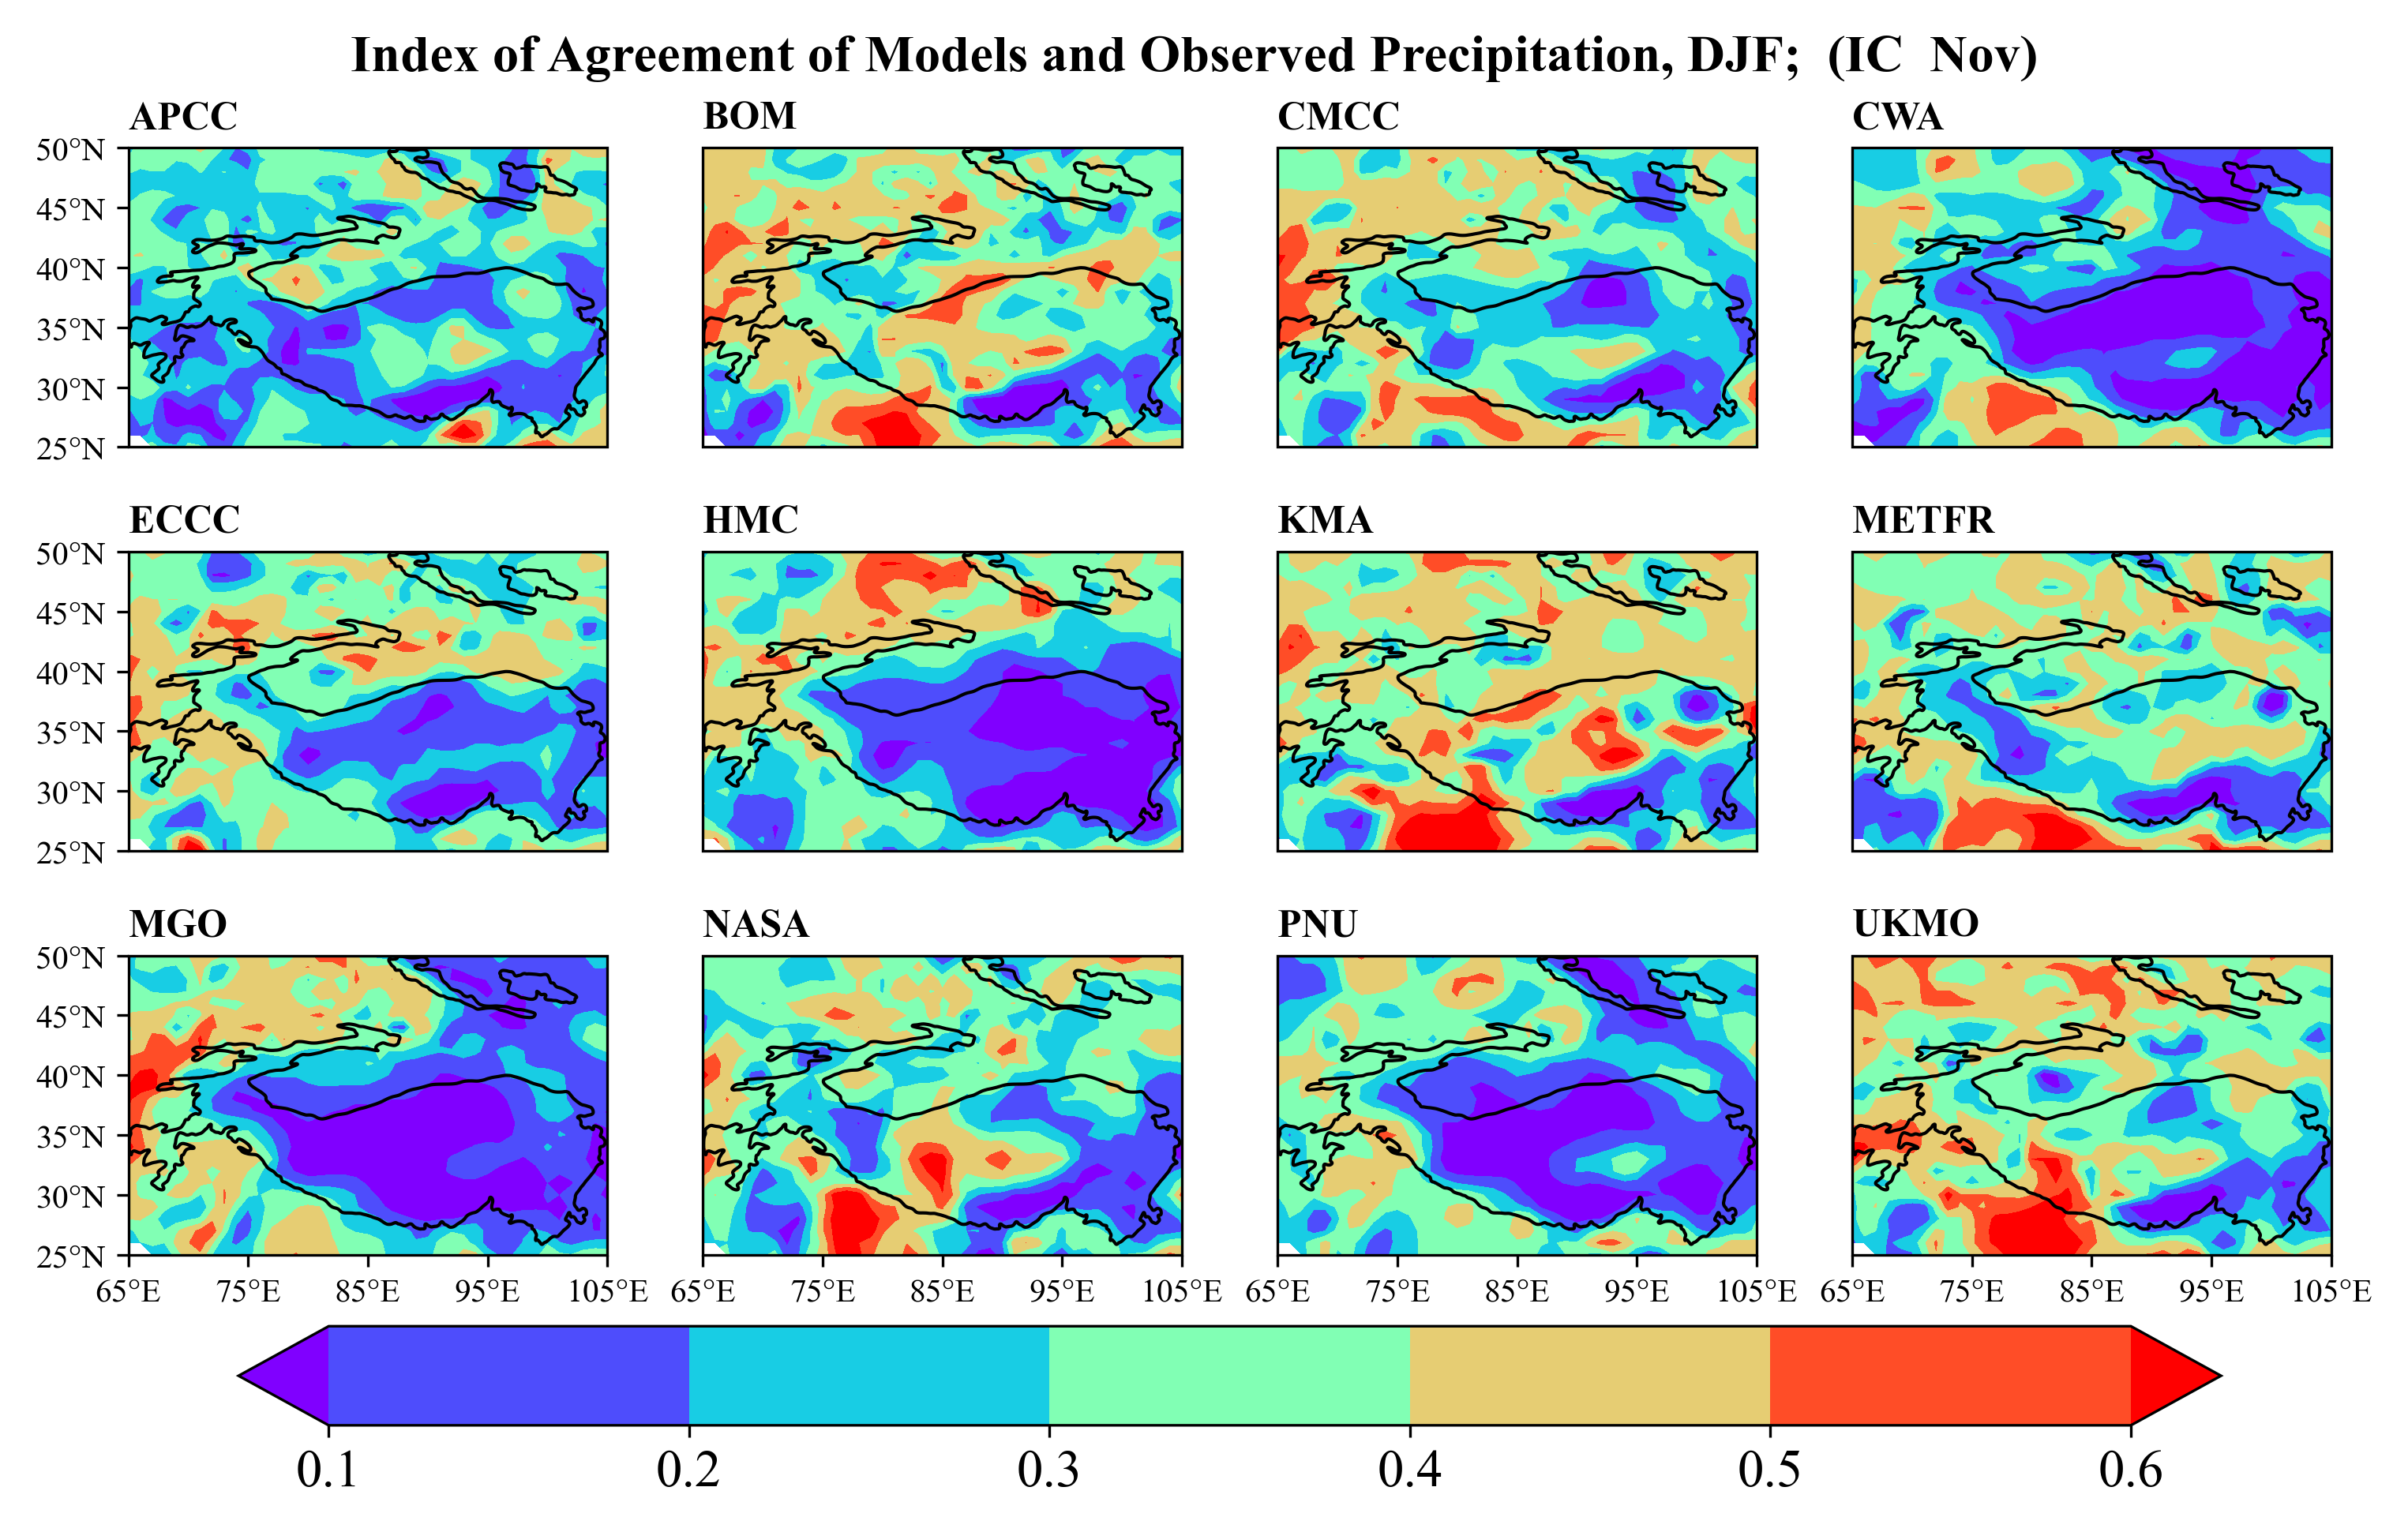
Figure 2 Index of Agreement between precipitation from observation and the models used for seasonal outlook.

Figure 3 RMSE between precipitation from observation and the models used for seasonal outlook.

Figure 1 Correlation between precipitation from observation and the models used for seasonal outlook, the stippling shows the correlation values significant at 95% confidence level.
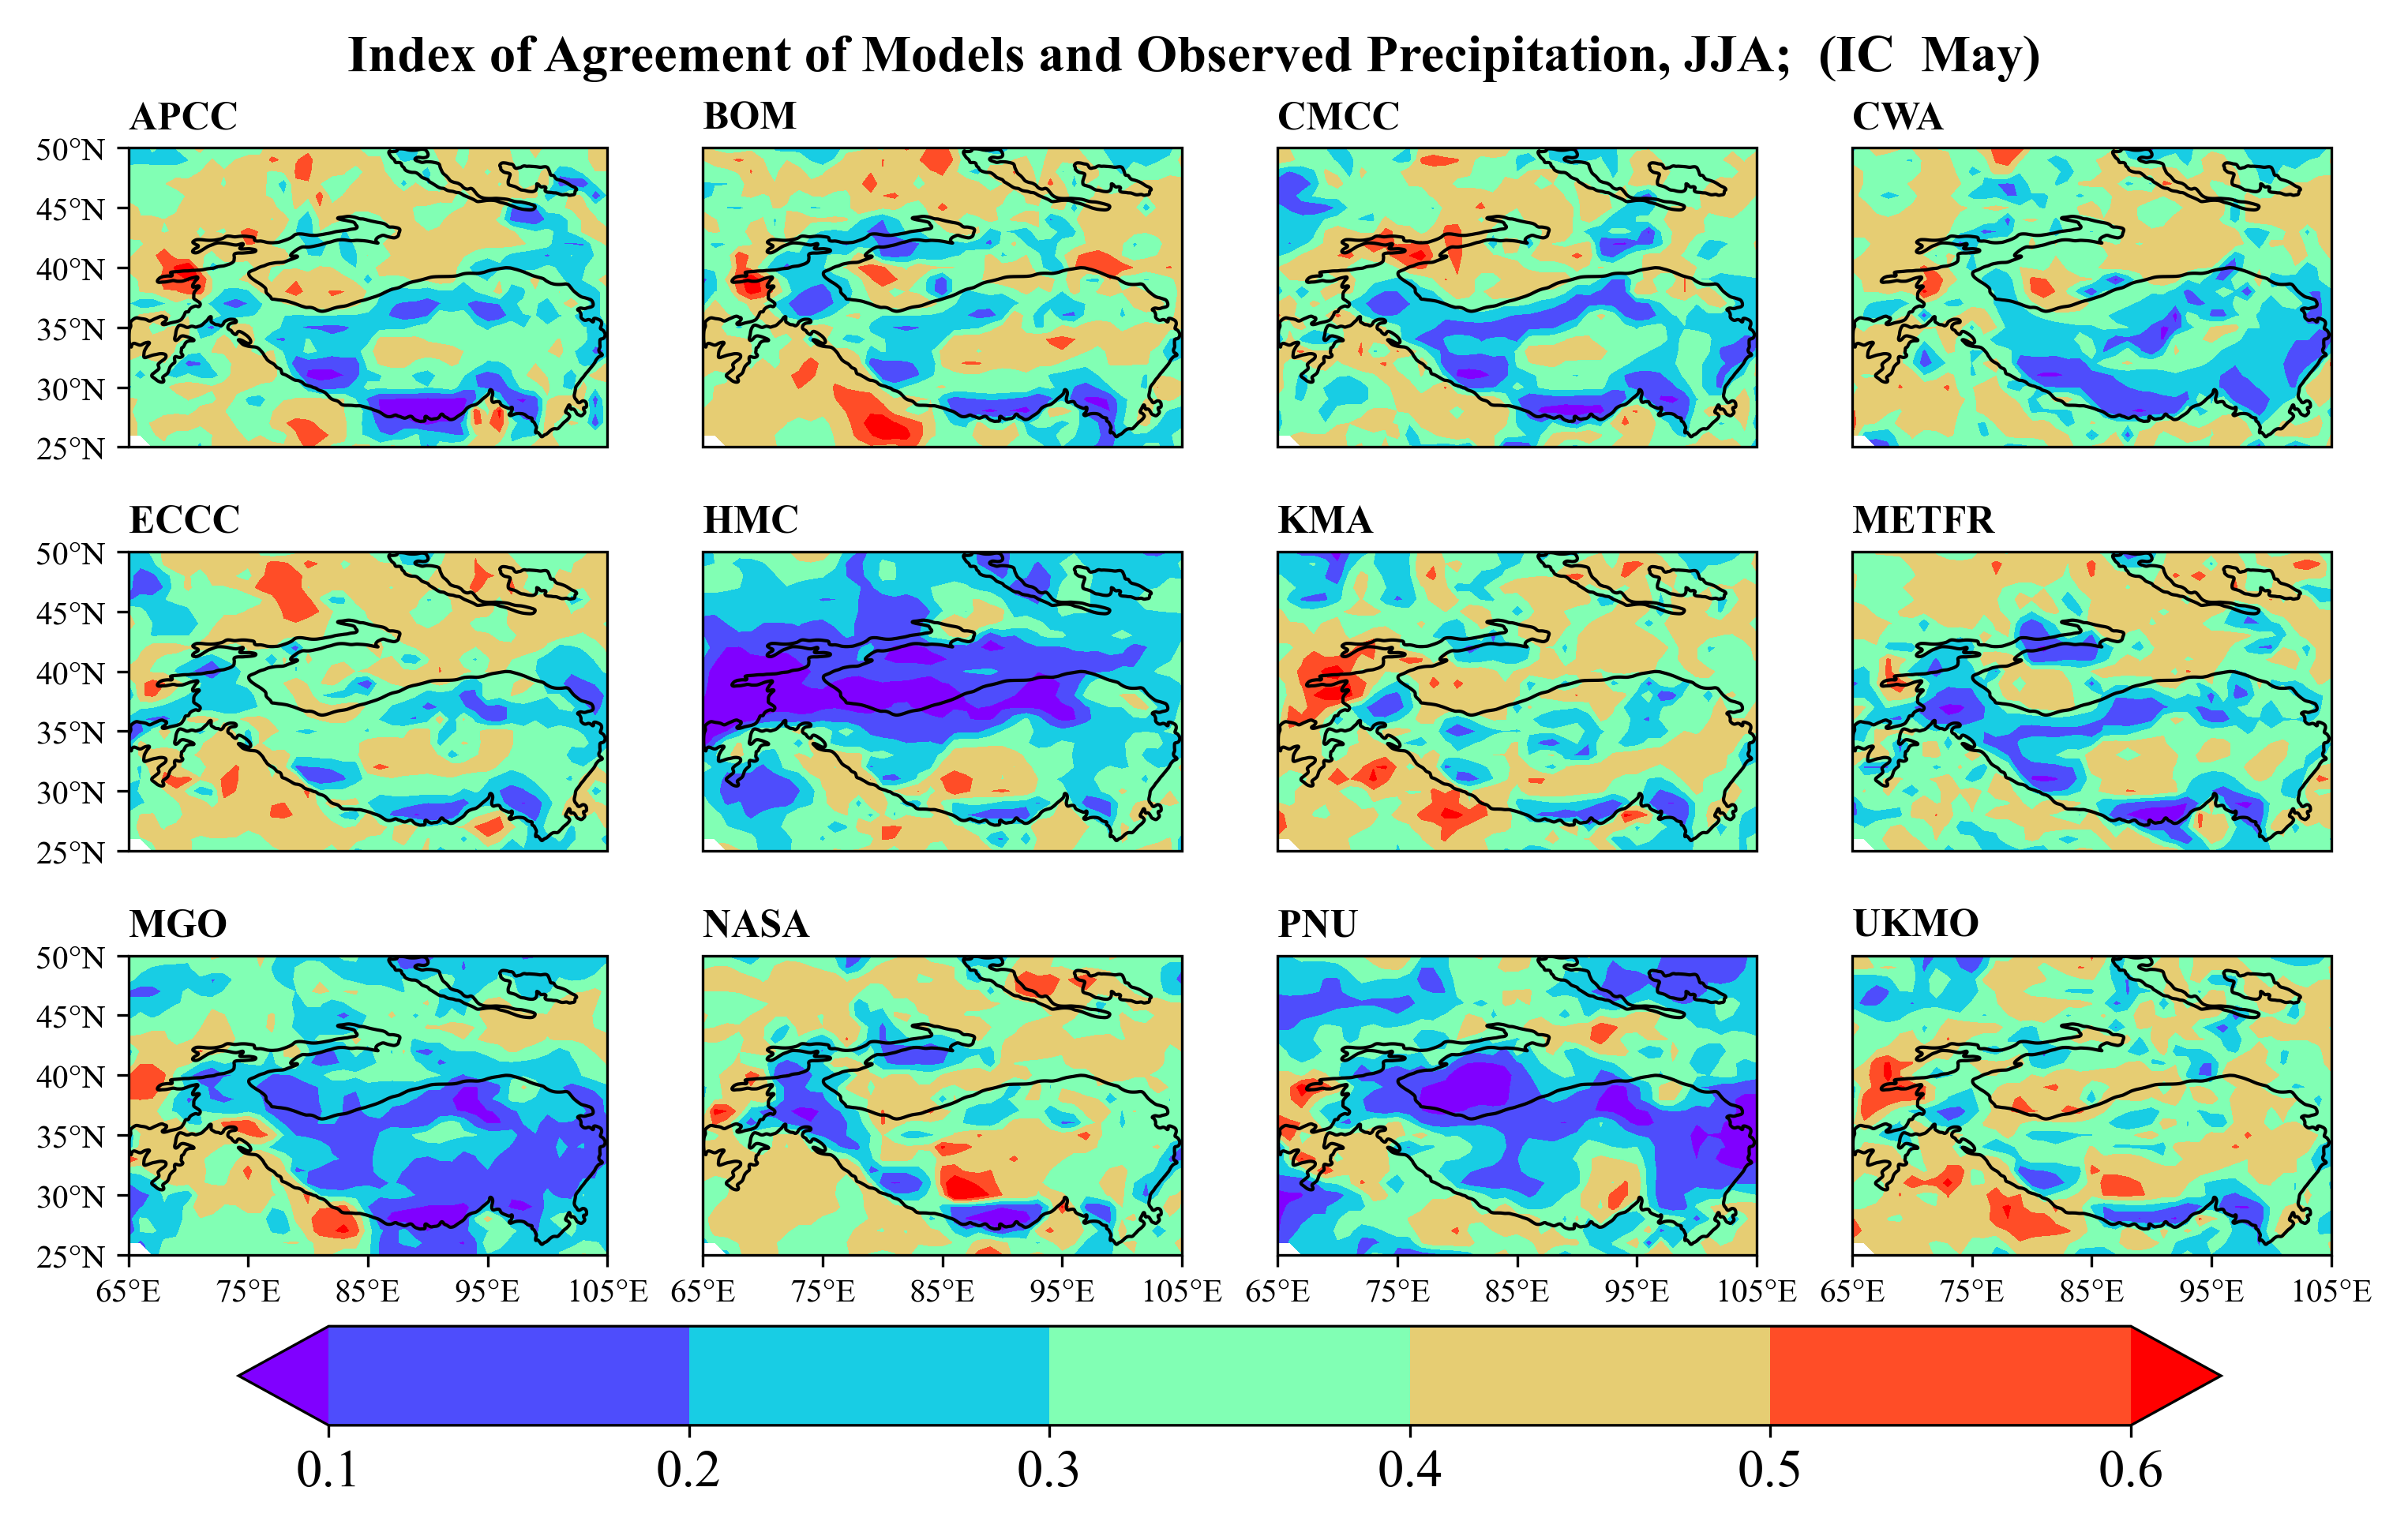
Figure 2 Index of Agreement between precipitation from observation and the models used for seasonal outlook.
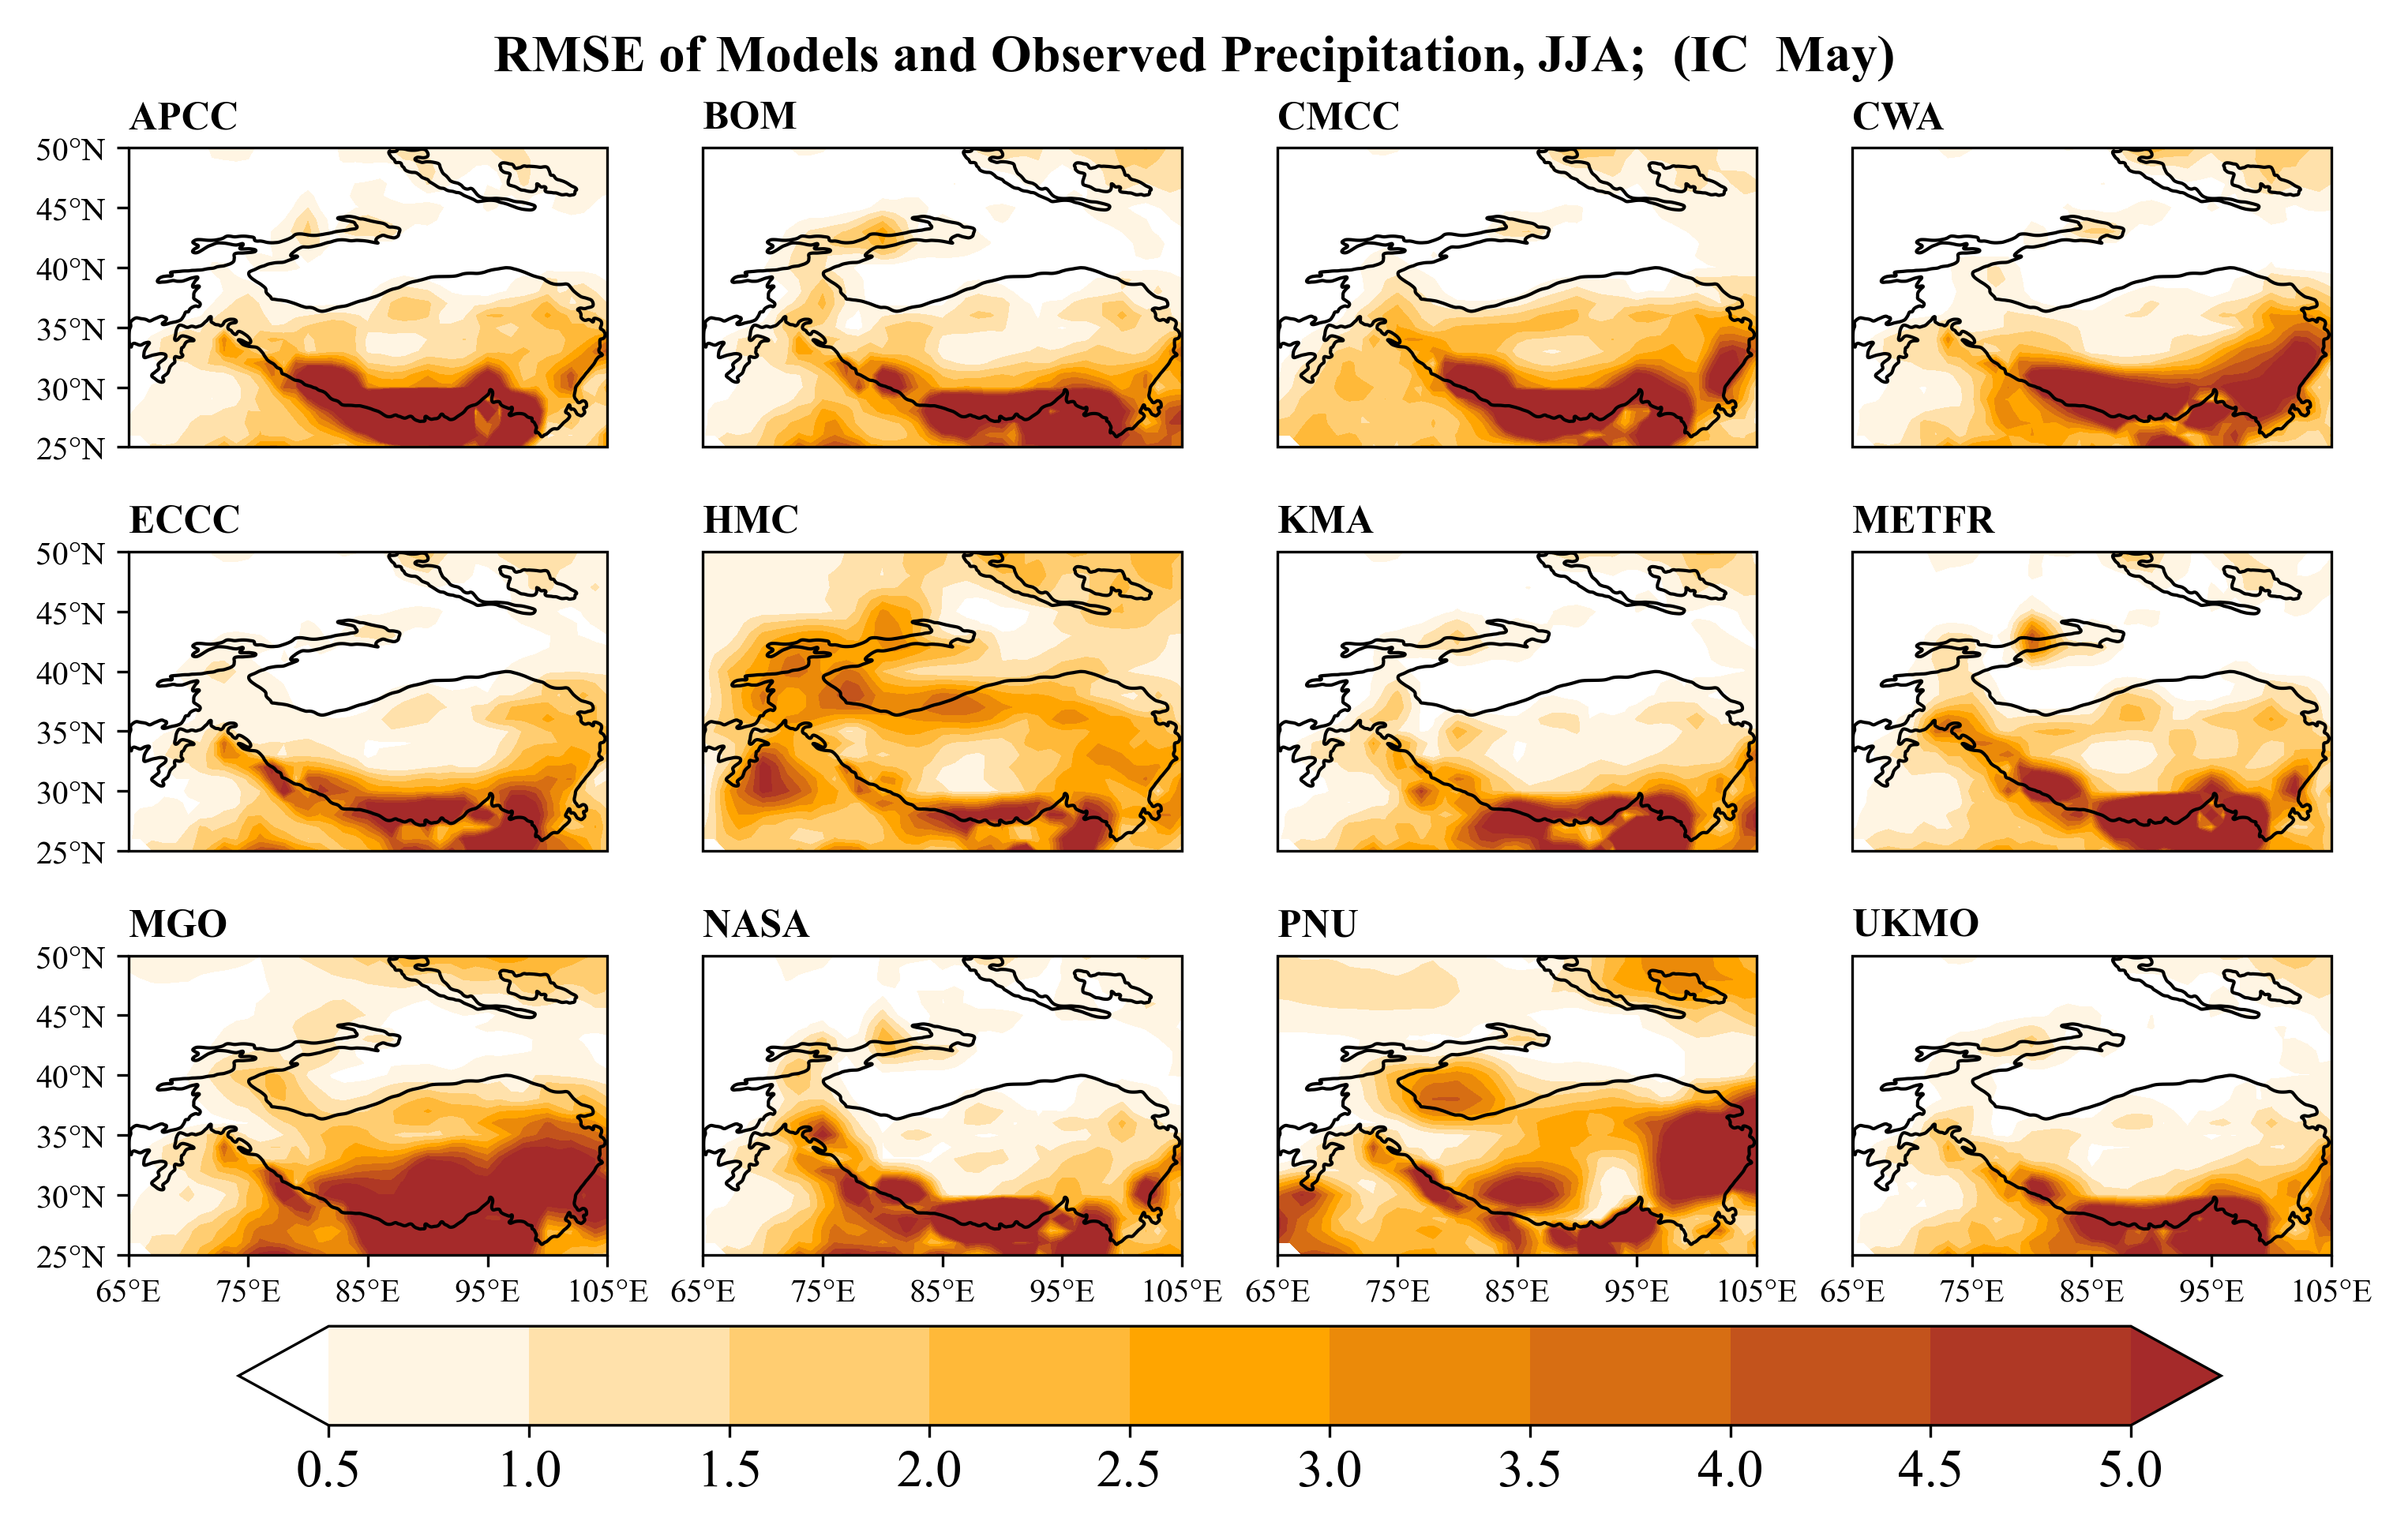
Figure 3 RMSE between precipitation from observation and the models used for seasonal outlook.

Figure 1 Correlation between precipitation from observation and the models used for seasonal outlook, the stippling shows the correlation values significant at 95% confidence level.
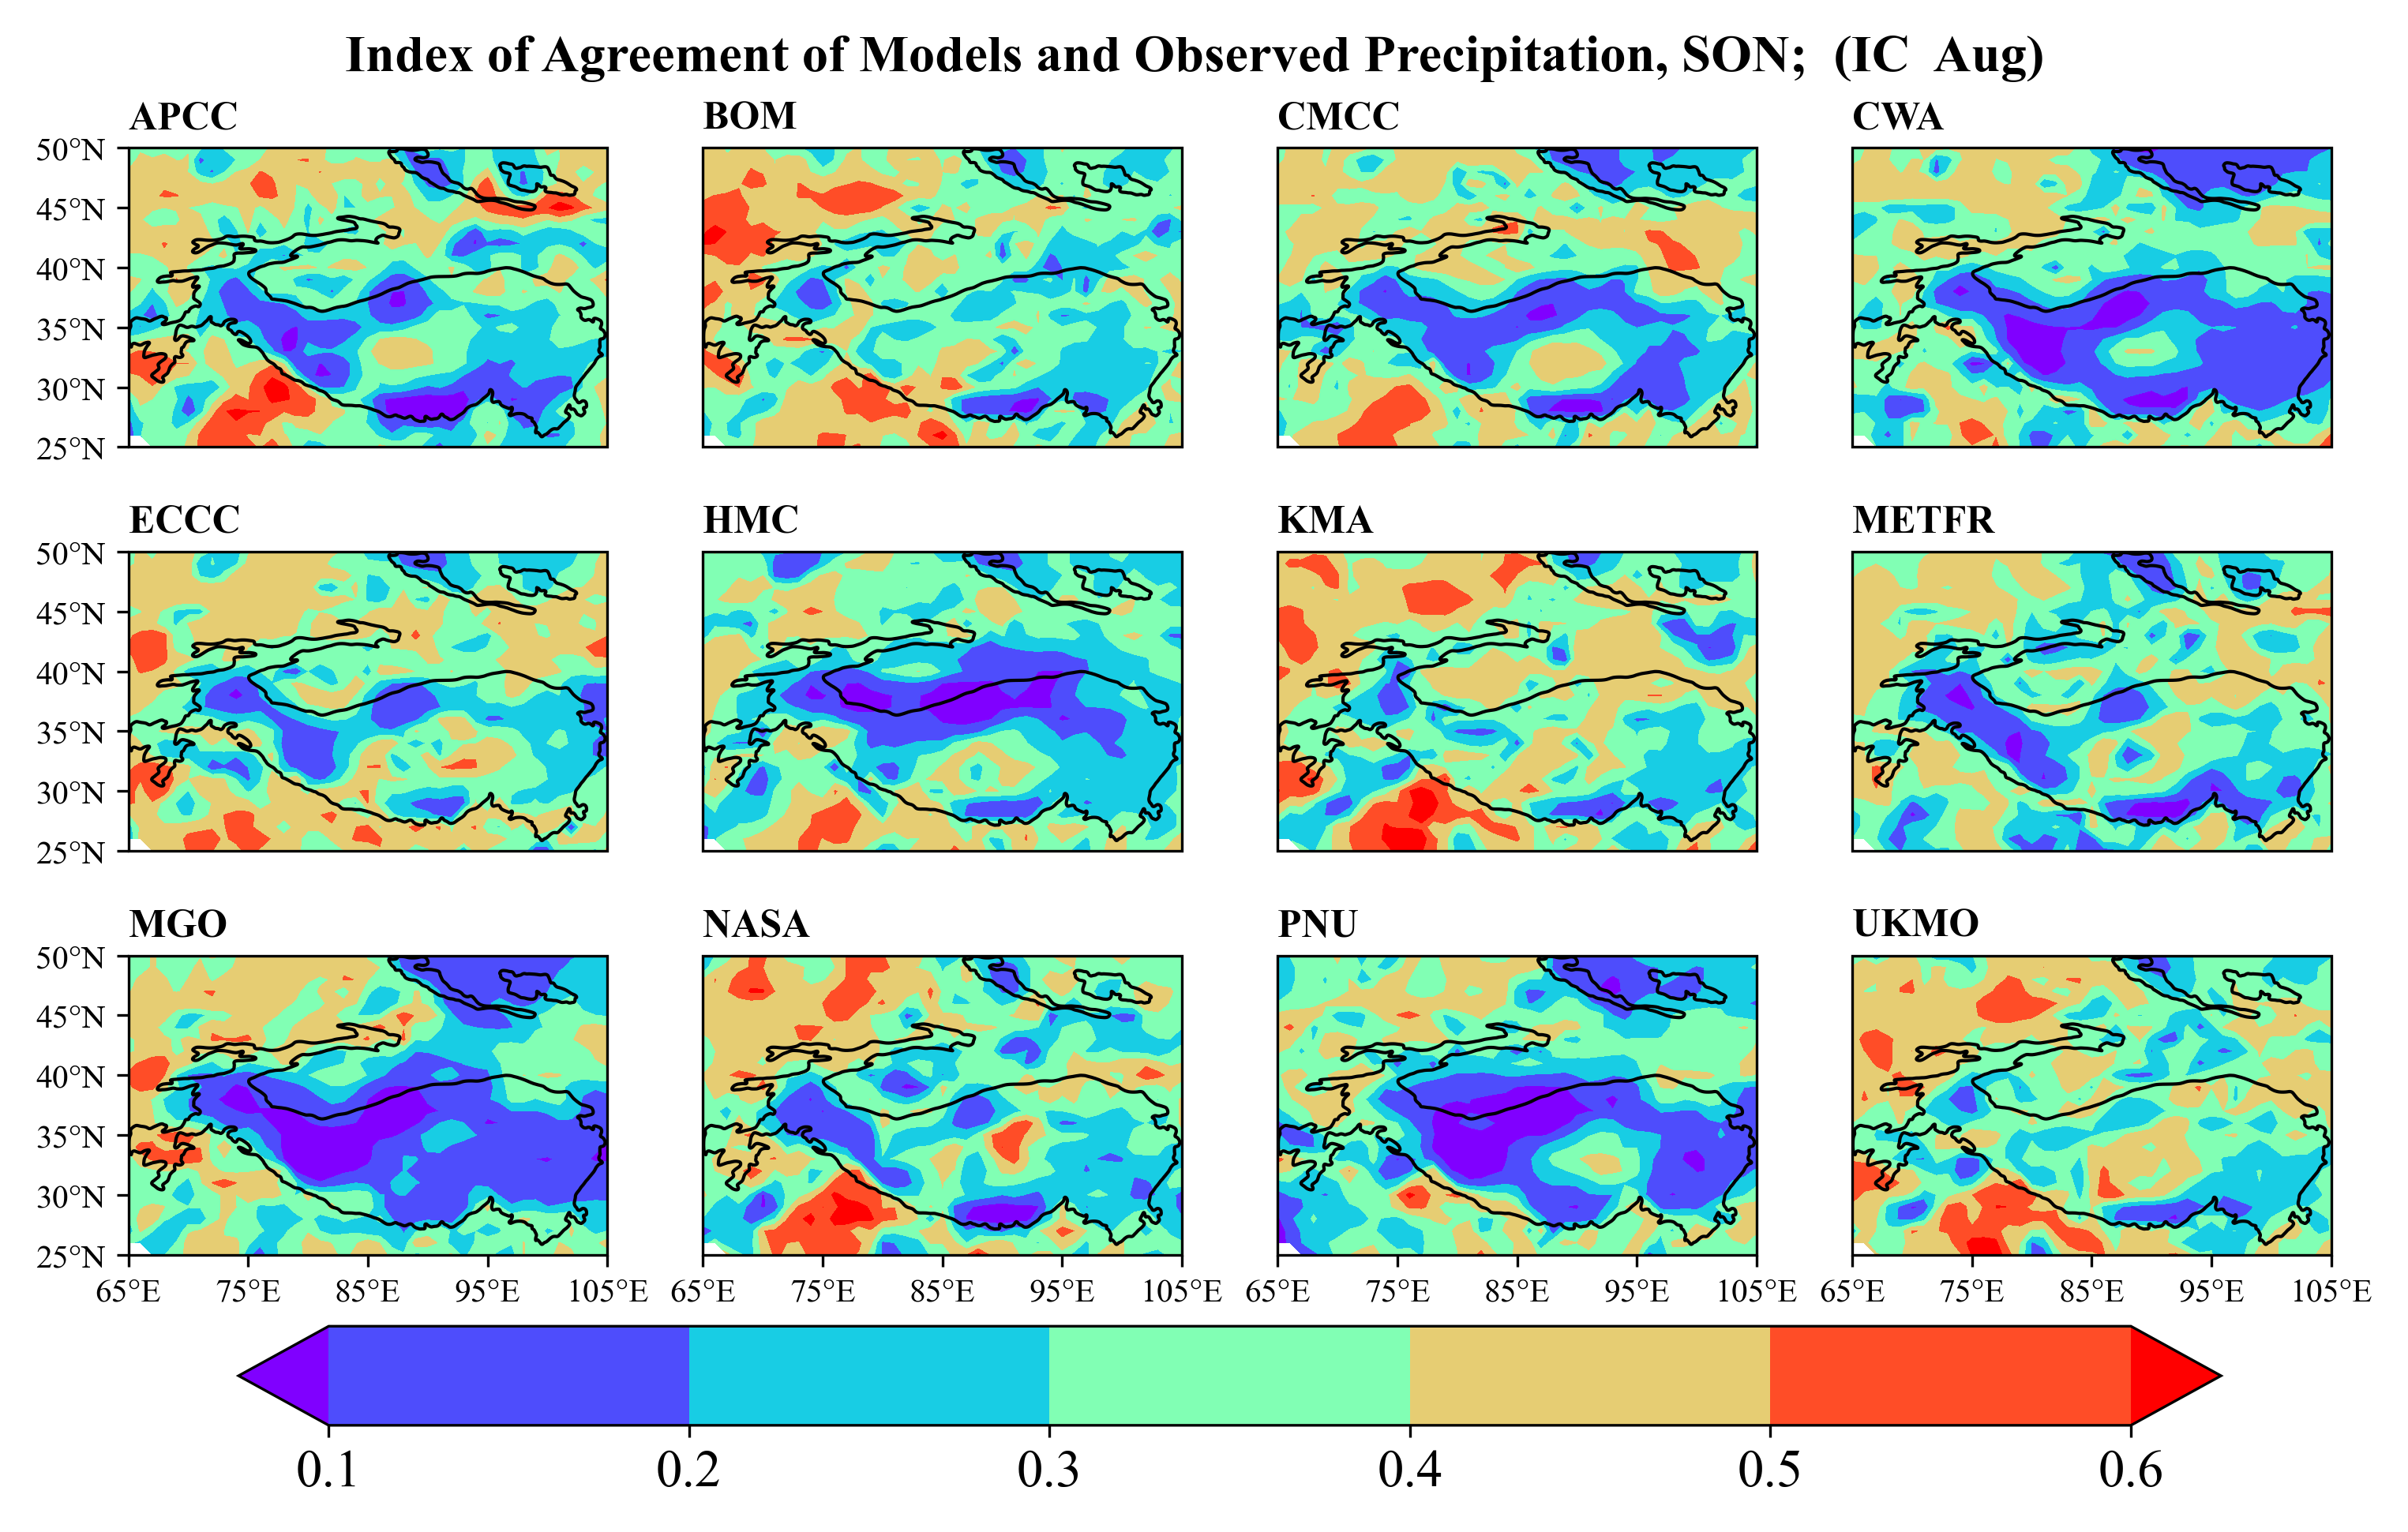
Figure 2 Index of Agreement between precipitation from observation and the models used for seasonal outlook.
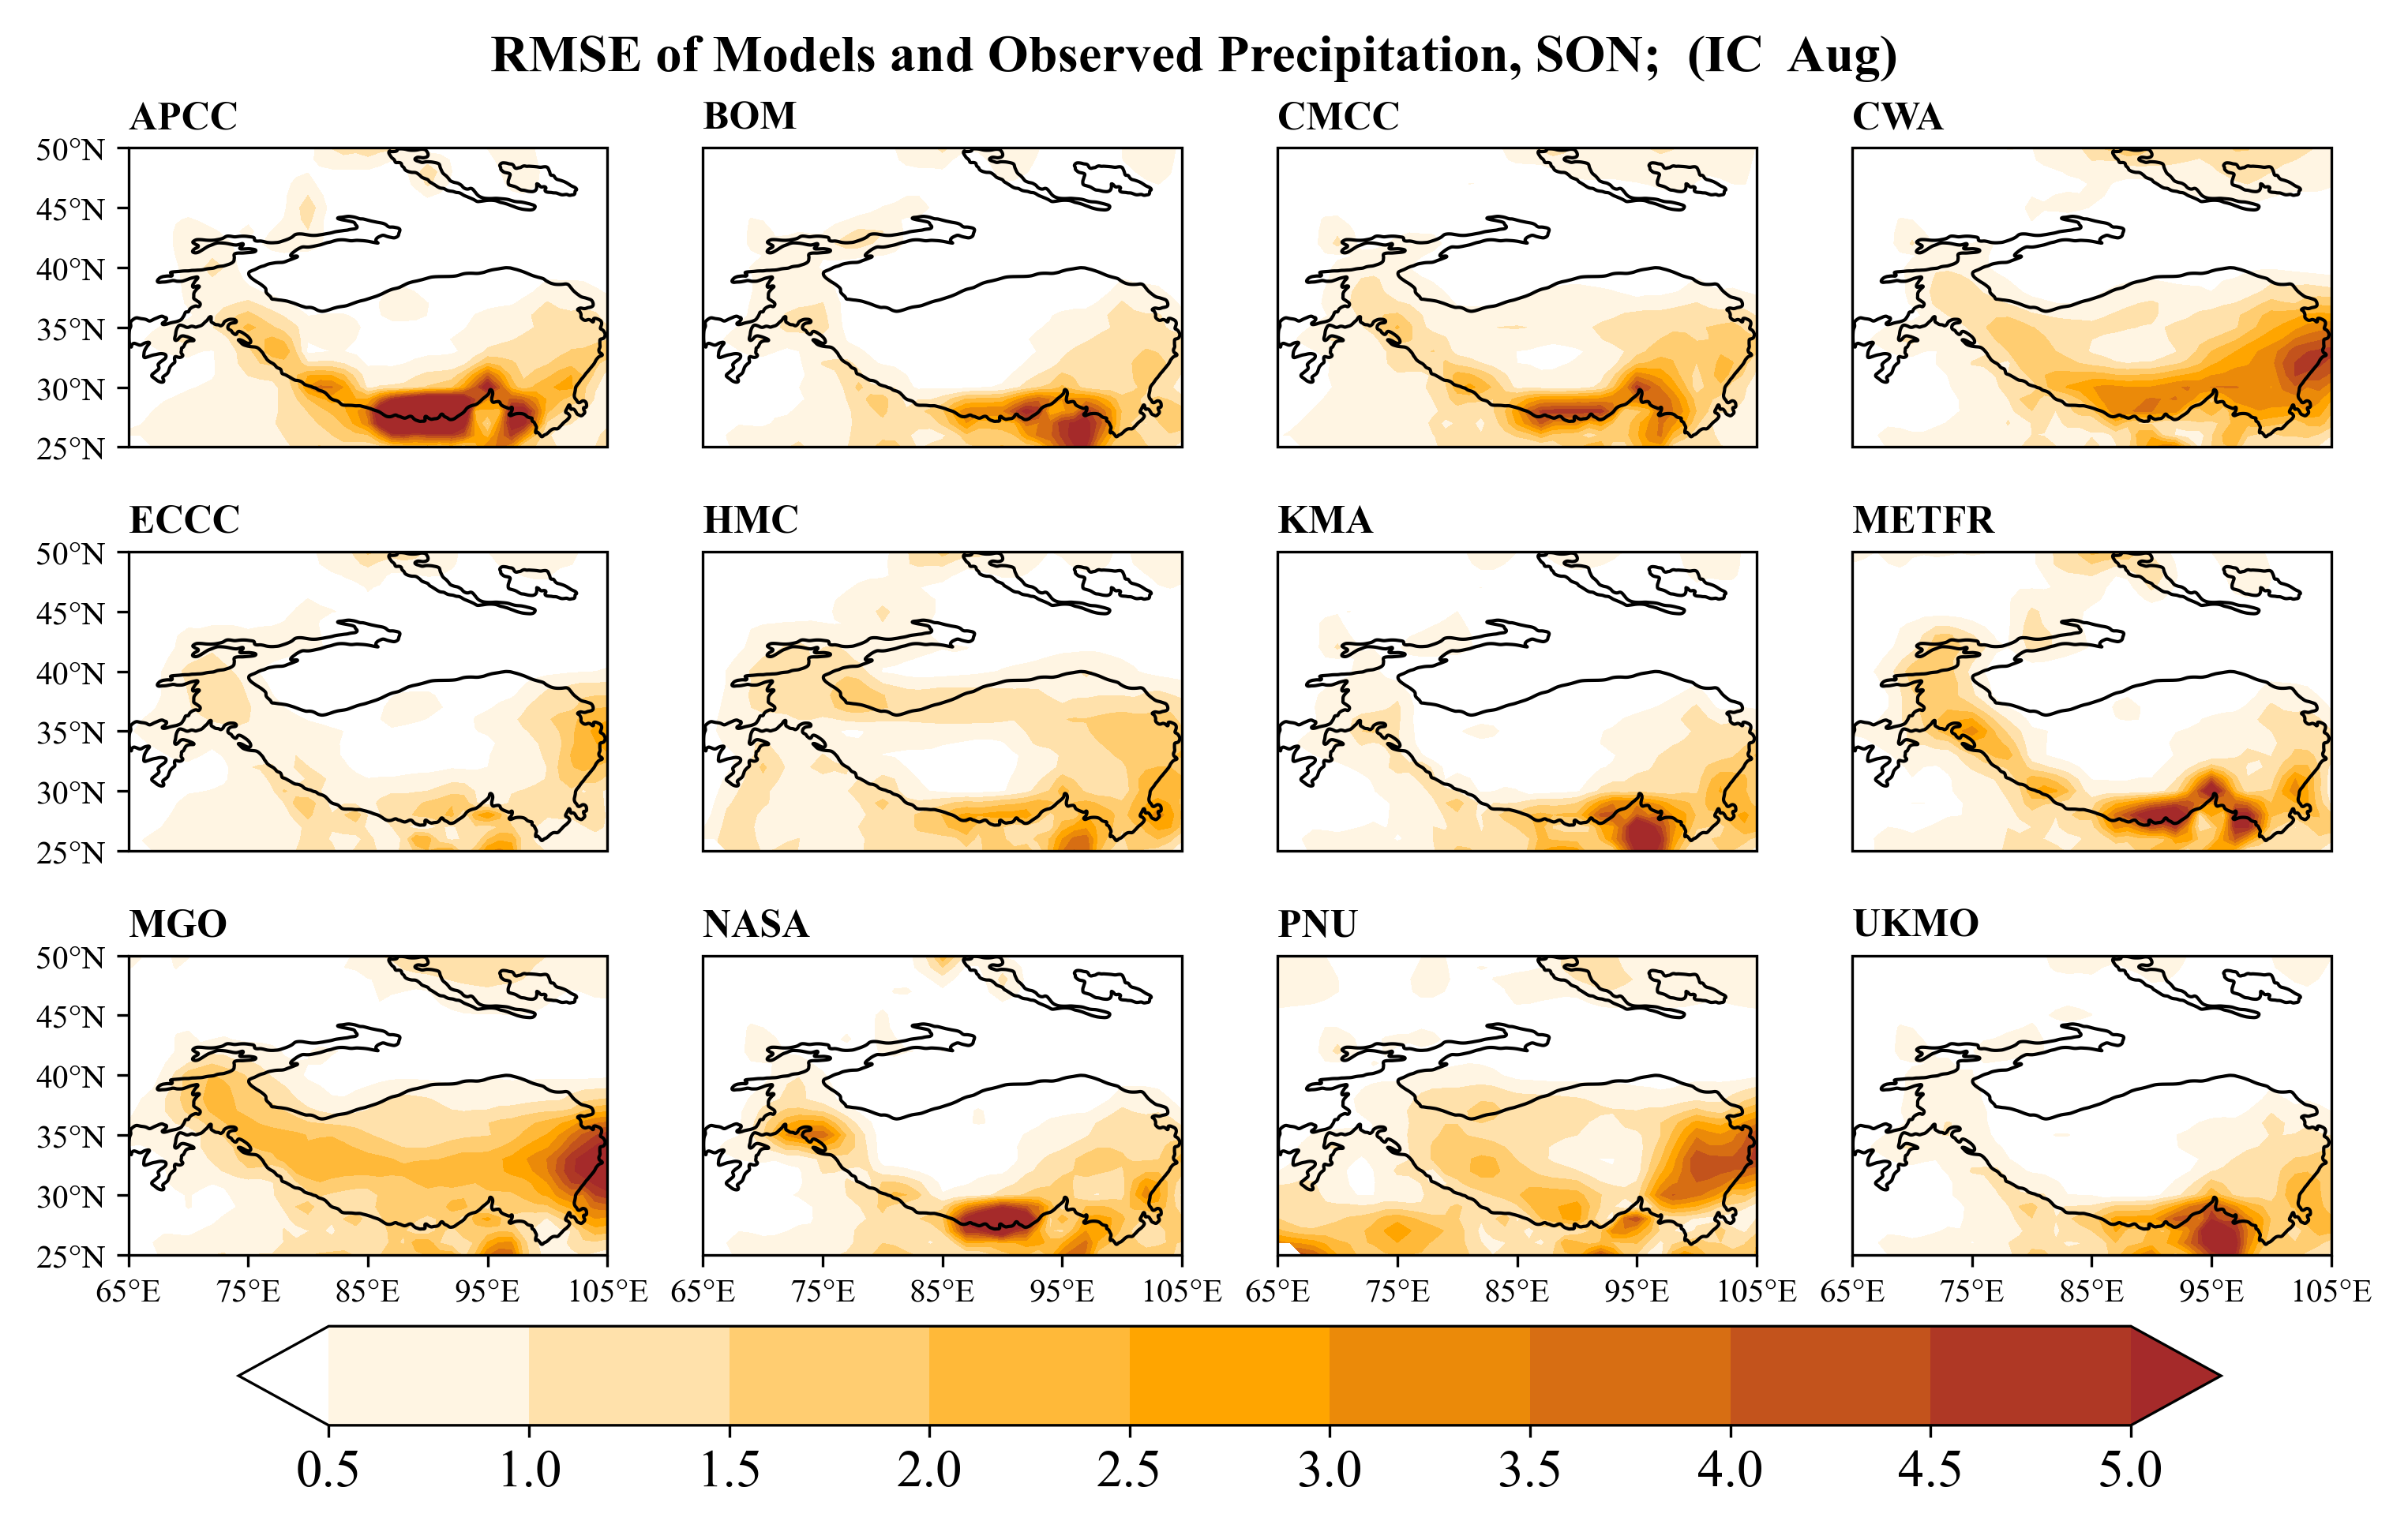
Figure 3 RMSE between precipitation from observation and the models used for seasonal outlook.